Overview
The Robert Koch Institute published intensive-care capacity per county as a CSV file. A file doesn't tell you how full the beds near you are, and during the pandemic many people without an epidemiology background were asking exactly that. This dashboard turns the published data into a map, a searchable table and a time series. The data is licensed CC BY 4.0, and the project isn't affiliated with the RKI.
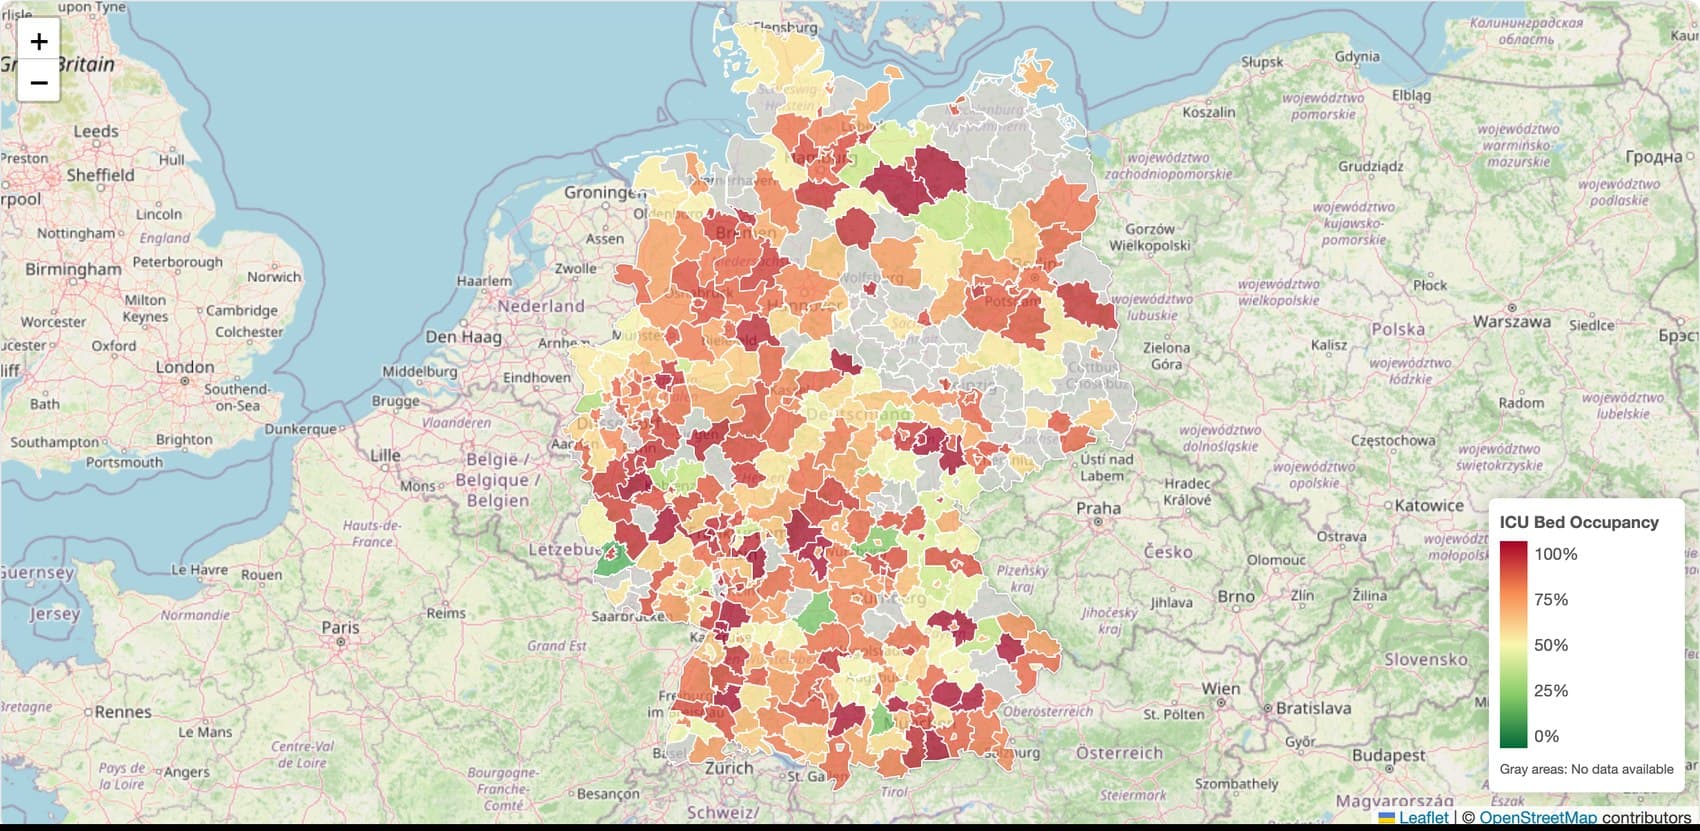
Three views for three questions
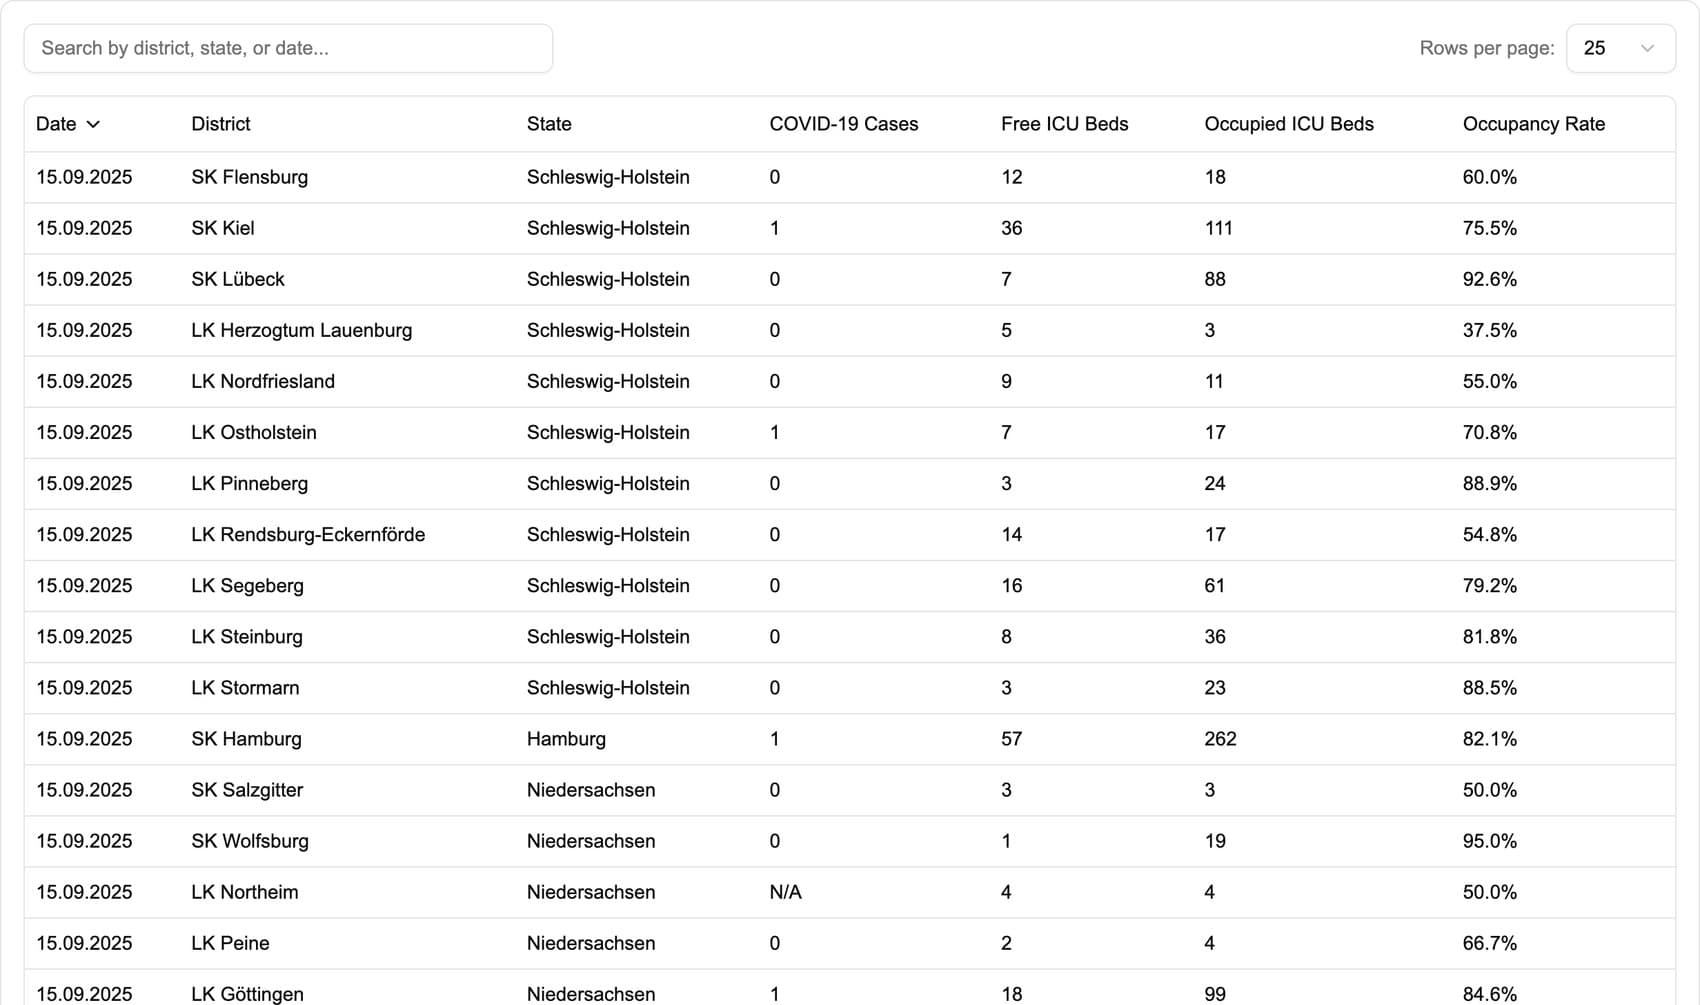
The map shows where beds are scarce at a glance. The table gives exact numbers and can be searched by district, state or date, with free beds, occupied beds and occupancy rate as sortable columns. The trend view plots one county's cases, free, occupied and total beds and occupancy rate over a range you choose. A colour map alone tempts people to estimate a number they should read, so I built all three.
Saying when the data is old
At some point the RKI county file stopped getting new rows. The dashboard now says how old its source data is, when it last checked for updates, and that nothing newer has appeared for more than a week. A public health dashboard that keeps showing year-old numbers as if they were current does more harm than an empty one. A notice like this is worth adding to any app that shows someone else's data.
Written between shifts
I wrote the first version during my voluntary year at DRK Neuss, in the gaps between patient transport shifts. It was the first project I built for a field I already worked in. It uses Next.js, React, Tailwind and Leaflet, and I kept it small so it could keep running with little maintenance.